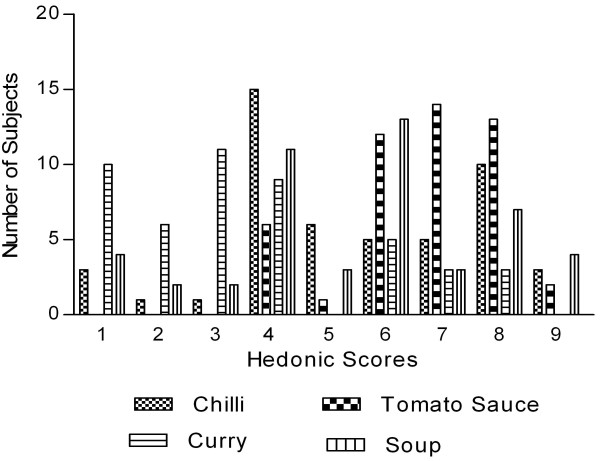
Figure 2.
Frequency distribution of hedonic scores for each food dish (n = 49). 50 g of bitter melon was incorporated into standard recipes of chili, tomato sauce, curry and soup. Data represents the hedonic score distribution: 1 = extremely dislike; 5 = neither like nor dislike; 9 = extremely like.

