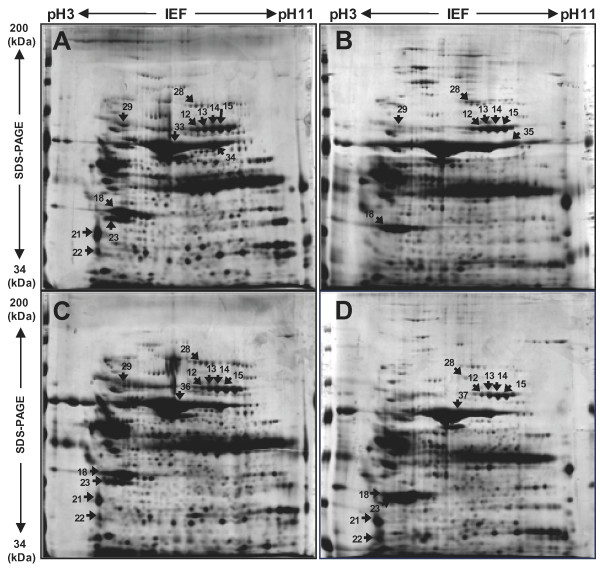
Figure 2.
Representative silver-stained 2D gel images of the different developmental stages of porcine endometrium. Proteins isolated from e NP, e 40, e 70 and e 93 with 200 μg of total protein loaded into the 2-DE gel. First dimension: 18 cm, with a pH of 3 to 11 linear IPG; second dimension: 8% gels (A, e NP; B, e 40; C, e 70; D, e 93). Among 3,000 spots visualized using silver staining, 53 proteins were identified from 12% and 8% gels (Figure A and B). Protein spots, which changed by more than twofold compared to the e NP control, were marked and identified using MALDI-TOF and MALDI-TOF/TOF MS.

