
Figure 3.
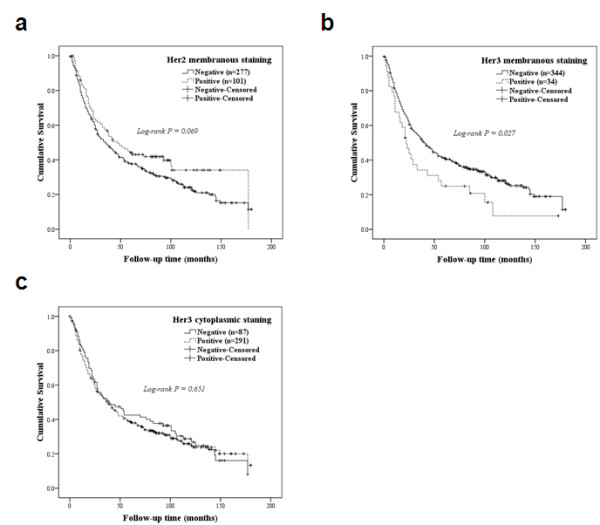
Kaplan-Meier survival analyses of HNSCC according to Her2 and Her3 expression. (a, c) The Log-rank test did not distinguish the patients with tumors that expressed high levels and low levels of Her2 membranous and Her3 cytoplasmic staining. (b) Patients with tumors displaying positive Her3 membranous expression (median survival, 22 months; n = 34) had a significantly worse survival time than those with tumors displaying negative membranous Her3 expression (median survival, 40 months; n = 344; log-rank test, p = 0.027).