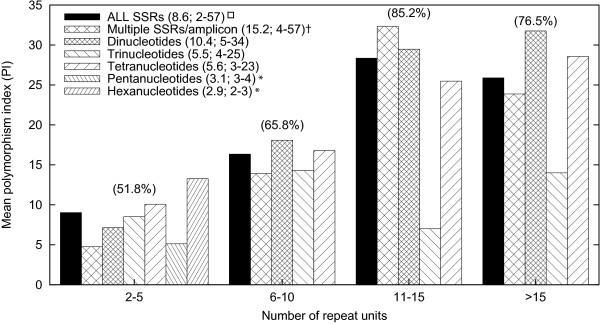
Figure 2.
Relationship between polymorphism and repeat number classes for perfect microsatellites. Polymorphism Index values were calculated based on marker evaluations in 7 carrot F2 families as described in materials and methods. Numbers in parenthesis above the bars indicate the percentage of polymorphic markers for a particular repeat number class (i.e., the % of markers that were polymorphic in at least one F2 population). The mean number and range of repeat units for each SSR type are provided in the legend. *All penta and hexanucleotides repeats had less than 5 repeat units and, thus, were only included in the first class. † For SSR markers that included more than 1 perfect microsatellite in their amplicon sequence the sum of all repeat units was considered [e.g., (AT)6, (CTT)5 = 11 repeats]. ☐ Includes all markers with perfect SSRs.

