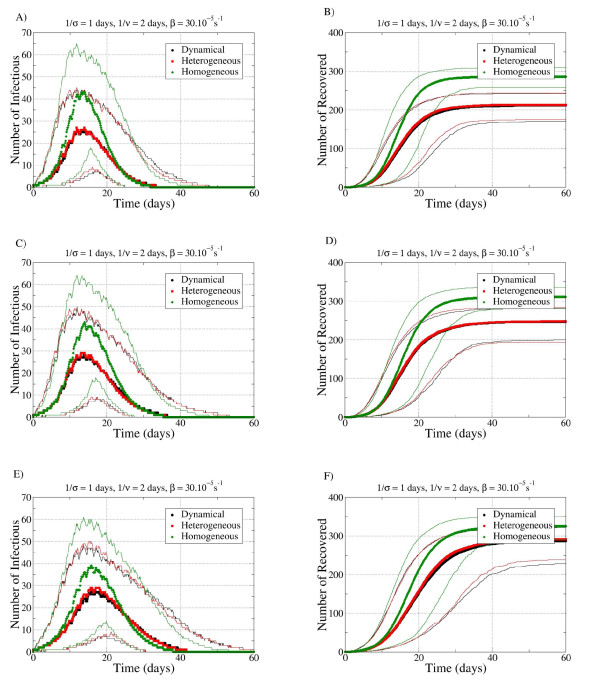
Figure 6.
Temporal evolution of the spreading process for the three networks with the parameters σ-1 = 1 days, v-1 = 2 days and β = 3.10-4/s (very short latency, very short infectiousness). (A, C, E) Evolution of the number of infectious individuals; (B, D, F) number of recovered. (A, B) Repetition (REP) procedure; (C, D) to the constrained shuffling (CONSTR-SH) procedure and panels E, F to the random shuffling (RAND-SH) one. Only runs with AR > 10% are taken into account. Symbols represent the median values, and lines represent the fifth and ninety-fifth percentiles of the number of infectious and recovered individuals.

