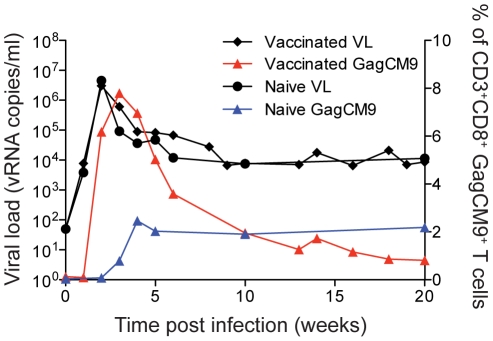
Figure 1. Viral load and GagCM9-specific CD8+ T cell tetramer staining.
The group mean viral load of the vaccinated animals (black diamonds and connecting lines) was comparable to the two mock-vaccinated, SIVsmE660-infected control animals (black circles and connecting lines); however, the vaccinated animals had higher frequencies of GagCM9-specific CD8+ T cells (red triangles and connecting line) than the mock-vaccinated control animals (blue triangles and connecting line).

