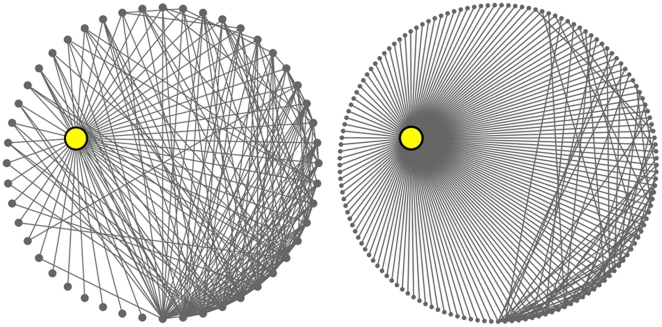
Figure 1. An illustration of the differences between DC and GDC.
Left: Direct neighborhood of ZAP90, a cancer and HIV gene, in the human PPI network [28]. Its degree is 48 and it is ranked as the top  gene with respect to DC. Right: Direct neighborhood of PRKACA, an HIV gene, in the network. Its degree is 145 and it is ranked as the top
  gene with respect to DC. Both proteins have the same GDC and are ranked as top
  genes with respect to GDC. Hence, GDC rewards the ranking of a low-degree gene if its 4-deep neighborhood is dense (ZAP90) and penalizes the ranking of a high-degree gene if its 4-deep neighborhood is sparse (PRKACA). (For the esthetics of the figure, we only show 1-deep neighborhoods.)

