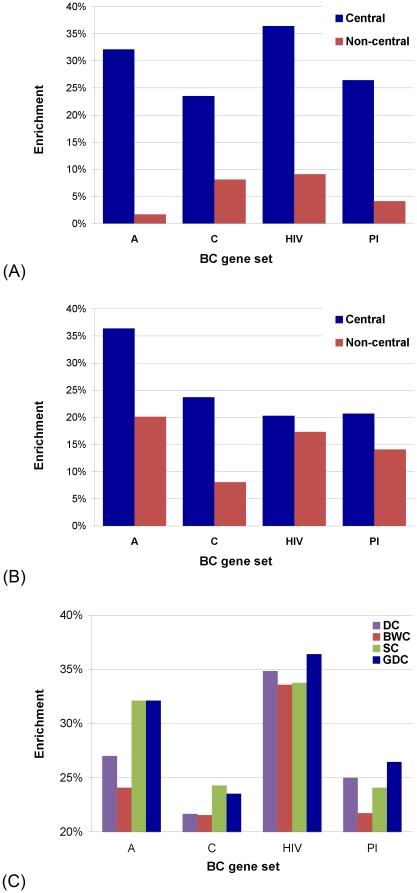
Figure 6. The performance of GDC and its comparison with other centrality measures.
(A) Enrichments in BC genes of the top  % of the most GDC-central genes (denoted by “Central”, blue bars) and all remaining genes (denoted by “Non-central”, red bars) in the human PPI network. (B) Enrichment in drug targets of BC genes that are GDC-central (“Central”) and BC genes that are non-GDC-central (“Non-central”). (C) Enrichments in BC genes of the top
  % of the most central genes in the human PPI network, with respect to the four centrality measures (DC, BWC, SC, and GDC), broken into the four BC gene categories (aging (A), cancer (C), HIV (HIV), and pathogen-interacting (PI) genes). In all panels, the values of
  where precision and recall cross (as illustrated in Figure 5) are used;
  equals 3, 10, 12, and 6, for A, C, HIV, and PI genes, respectively, for each of the four centrality measures.

