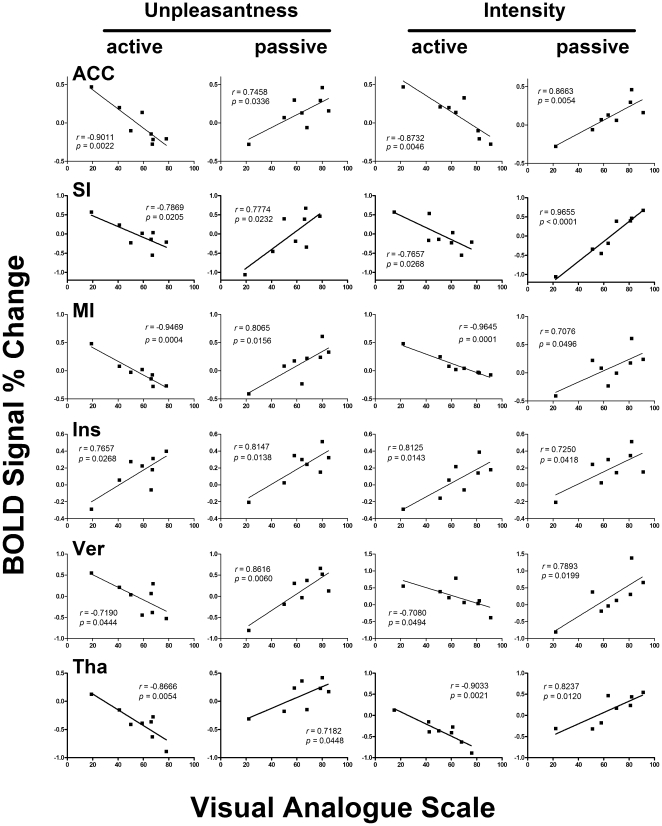
Figure 3. Correlation analysis between BOLD signal changes and pain ratings.
Linear correlation analyses were performed for the BOLD signal changes in the ROIs with the unpleasantness ratings (left two columns) or pain intensity ratings (right two columns). Panels in the six rows (top to bottom) are scatter plots for the anterior cingulate cortex (ACC), the primary somatosensory cortex (SI), the primary motor cortex (MI), the insula (Ins), the vermis of cerebellum (Ver), and the thalamus (Tha). All ROIs except for the insula were negatively correlated with the ratings in active pain and positively correlated with ratings in passive pain. The Insula, however, were consistently correlated with all ratings in both conditions. All of the ROIs are based on functional and structural masks.

