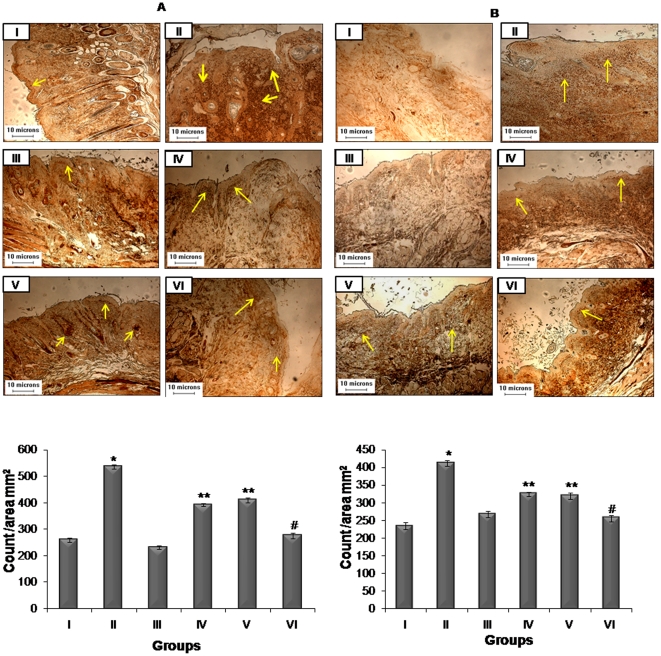
Figure 4. Effects of resveratrol and BTP treatment on modulation of PCNA expression.
(A) Long and (B) short term experiments. Details are described in Materials and methods section. The brown colour nuclei mark the reactivity with PCNA indicated by arrows. Bar diagram shows mean ± SD of three independent sets analysis. *significantly increased in comparison of group I (p<0.01), **significantly decreased when compared with group II (p<0.01). #significantly decreased when compared with groups IV and V (p<0.01).

