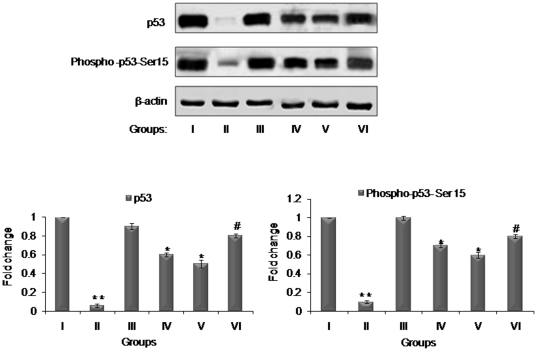
Figure 5. Effects of resveratrol and BTP treatment on modulation of p53 expression and p53 phosphorylation and stabilization.
Details for groups and treatments are described in Materials and methods section. The bands shown here are from a representative experiment repeated three times with similar results. Equal loading was confirmed by stripping the immunoblot and reprobing it for β-actin. The pixel density of the specific immunoreactive bands was quantified by densitometry and expressed as a fold difference against β-actin. ** less than corresponding value of untreated control group I (p<0.05). * more than corresponding value of DMBA and TPA group III (p<0.05). # more than corresponding value of BTP and Res alone treated groups IV and V (p<0.05).

