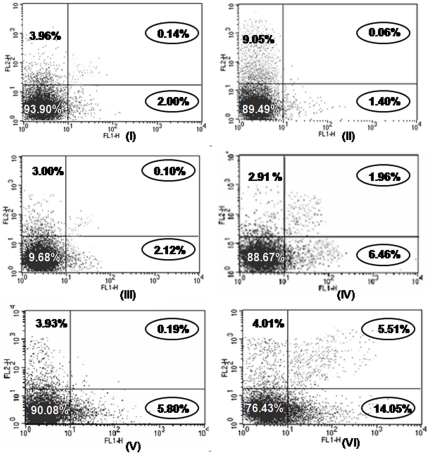
Figure 6. Representative figure of flow cytometric analysis of apoptosis in mouse skin on treatment with resveratrol and BTP.
The data is representative of three independent experiments (p<0.05). Details are described in Materials and methods section. Figure showing cells in the upper right (UR), upper left (UL) and lower right (LR) portions portion of the picture indicates late apoptotic cells, necrotic and pre-apoptotic cells, respectively whereas cells present in lower left (LL) portion of the picture indicate percentage of live cells.

