
Figure 1.
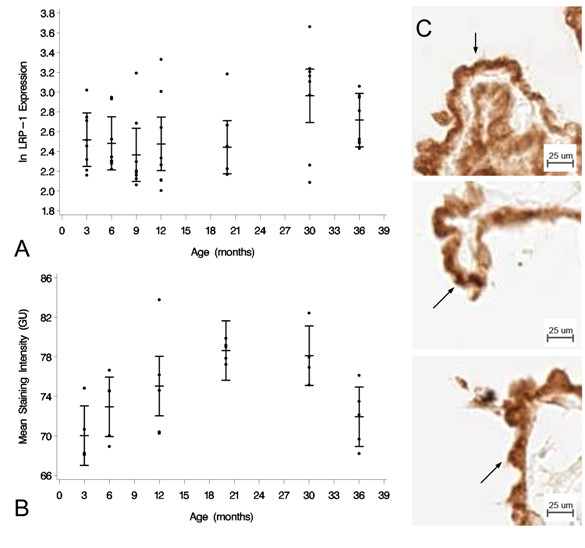
LRP-1 expression at the CP epithelium with age. (A) Graph of the log-transformed normalized expression of LRP-1 with age, n = 8 for each age group tested (4 rats, 8 CPs pooled for each "n", 32 rats for an n = 8). One-way ANOVA revealed a significant increase in LRP-1 expression (p = 0.047). Significance was reached between 9 and 30 mo 95% confidence limits (0.0122, 1.1828). Error bars represent 95% confidence intervals for the means. (B) Semi-quantitative IHC for LRP-1 expression in grayscale units (GU). Mean staining intensity was significantly different (p <0.05) for the six age groups, n = 5 for each age group (5 rats, 2 CPs for each sample). (C) IHC of LRP-1 expression at 3 mo (top), 30 mo (center) and 36 mo (bottom) old rats. Staining is localized to the apical membrane (arrows).