
Figure 5.
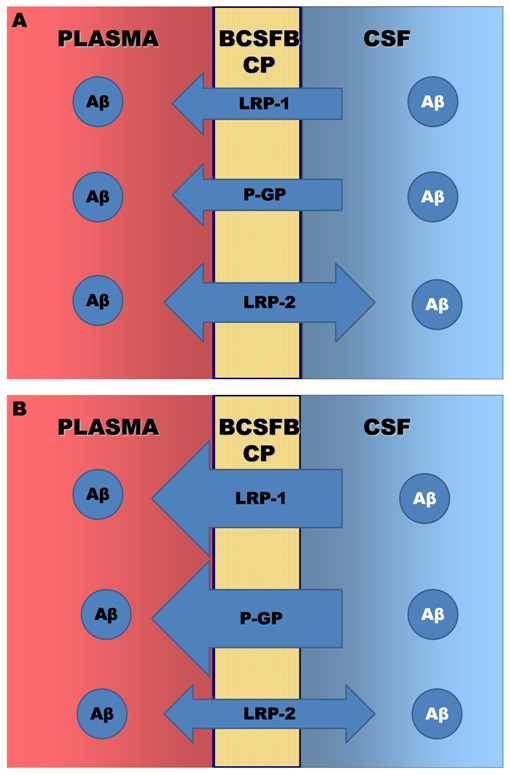
Diagrams of the direction and expression of the Aβ transporters at the BCSFB. (A) Diagram to show the direction and relative expression of LRP-1, P-gp and LRP-2 at three months of age in the BN/F rat. (B) Diagram of the relative expression of the three transporters after 20 months. Note that LRP-1 and P-gp expression increase, whereas LRP-2 expression decreases with age.