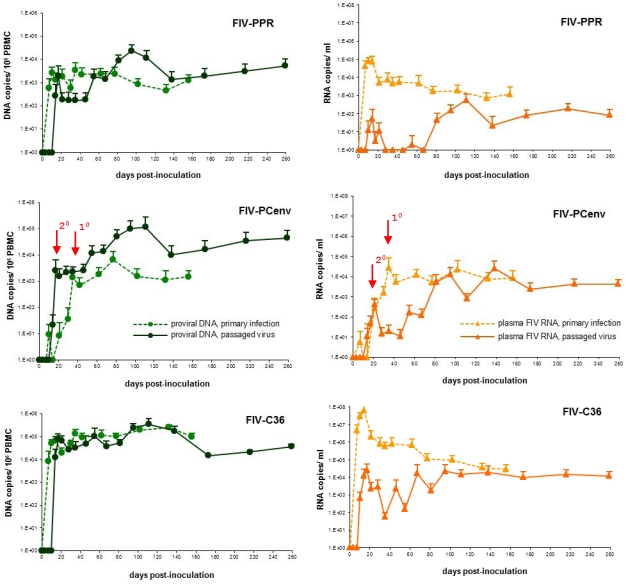
Figure 6. Comparative replication kinetics of primary (dashed lines) viral infection versus passaged (solid lines) FIV-PPR, FIV-PCenv, and FIV-C36.
Proviral loads recorded as gag equivalents/106 cells are depicted in green, and circulating virus as RNA genomes/ml in orange. Red arrows mark the delay in onset of acute viremia in primary versus secondary FIV-PCenv infections.

