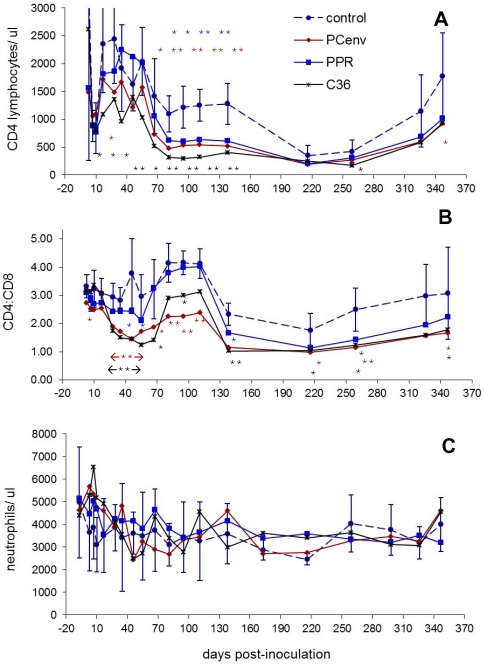
Figure 8. Timecourse of hematologic changes in domestic cats infected with passaged FIV-PPR, PC-env, and C36.
Blood was sampled at various time points over the course of infection. Complete blood counts, differential leukocyte analysis, and CD4+ and CD8+ T-lymphocyte percentages in virus-inoculated cats (n = 5/group), or sham-inoculated control cats (n = 5) were calculated. CD4 counts (shown as number of cells/µl) (A), CD4∶CD8 ratios (B), and neutrophil counts (shown as cells/µl) (C) are demonstrated over the course of the study. For ease of viewing, error bars are shown for control group only. Statistically significant values relative to normal control values are indicated by asterisks in same colors used for each viral group (*, P between 0.01 and 0.05; **, P<0.01).

