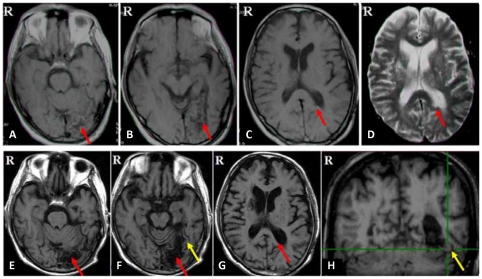
Figure 1. Lesions and intact VWFA shown in the structural MRI of the patient's brain.
The red arrows indicate the infarctions in the left ventral medial occipitotemporal cortex (A, B, E and F) and the left splenium of the corpus callosum extending to the left major forceps (C, D and G). The yellow arrow indicates the intact left lateral mid-fusiform cortex and occipitotemporal sulcus (F and H). The VWFA is highlighted with the green crosshair (Talairach coordinates: x = −43, y = −54, z = −12) in a coronal slice of spatially normalized SPGR images (H).

