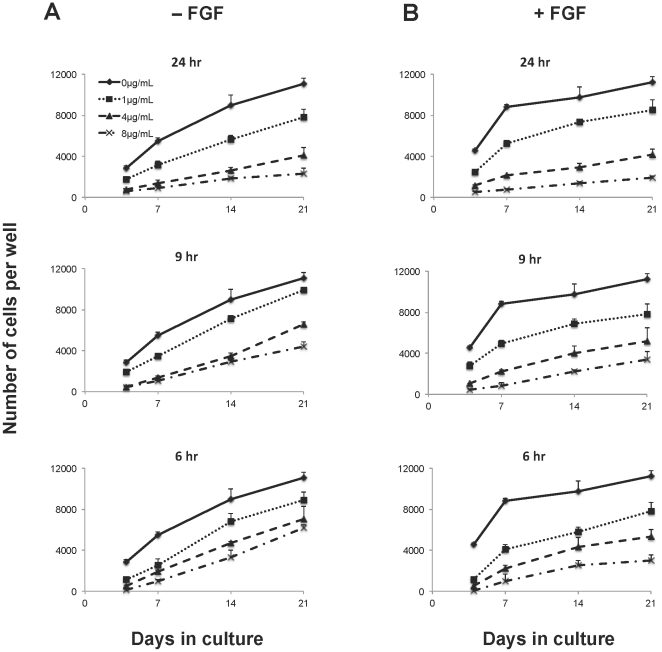
Figure 2. Inhibition of hMSC proliferation after polybrene exposure.
Plot of cell number over 21 days as measured by the CyQUANT assay. Human MSCs were seeded at the same density in 96-well plates, exposed to different concentrations of polybrene for different lengths of time, and cultured in 50 µl of medium per well without (A) or with FGF-2 (B). The untreated controls are the same for the different time points. The graphs are all on the same scale. Values are mean ± SD.

