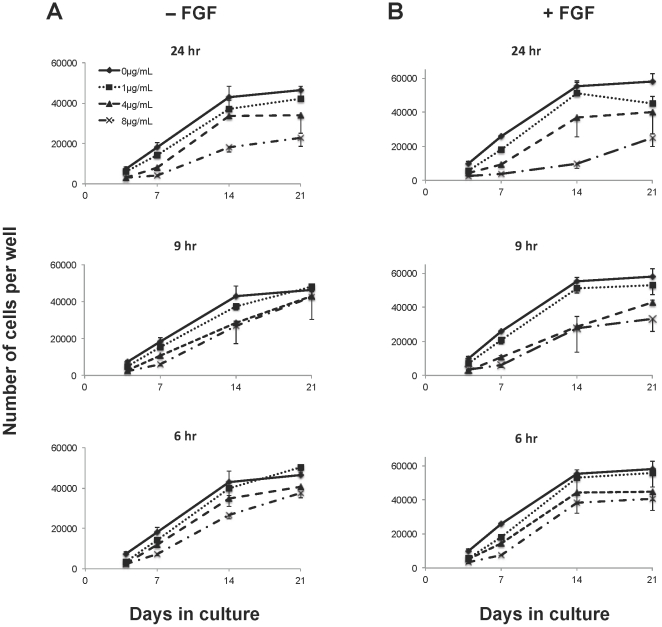
Figure 3. Effect of hypoxic conditions on polybrene inhibition of hMSC proliferation.
Plot of cell number over 21 days as measured by the CyQUANT assay of hMSCs cultured in 200 µl of medium per well in the absence (A) or presence (B) of FGF-2. The untreated controls are the same for the different time points. The graphs are all on the same scale. Values are mean ± SD.

