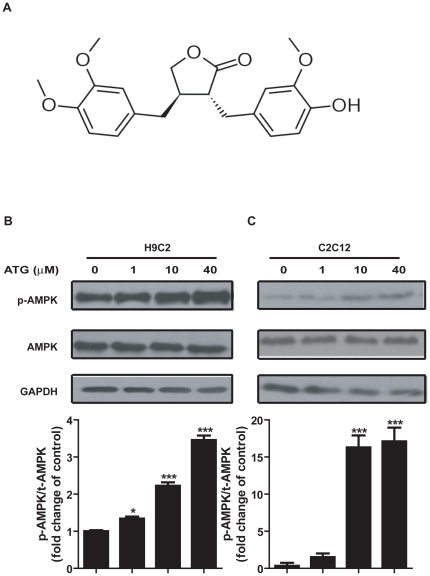
Figure 1. Arctigenin (ATG) increased AMPK phosphorylation in H9C2 and C2C12 cells.
A. Chemical structure of arctigenin. B. C H9C2 (B) and differentiated C2C12 (C) cells were treated with indicated concentrations of arctigenin (0-40 µM) for 30 min, AMPK phosphorylation and total AMPK levels were determined by western blotting. The results shown are representative of three independent experiments. The bands were quantified using Image-Pro Plus software. Values are means ± SE. *, p<0.05; ***, p<0.005; one-way ANOVA.

