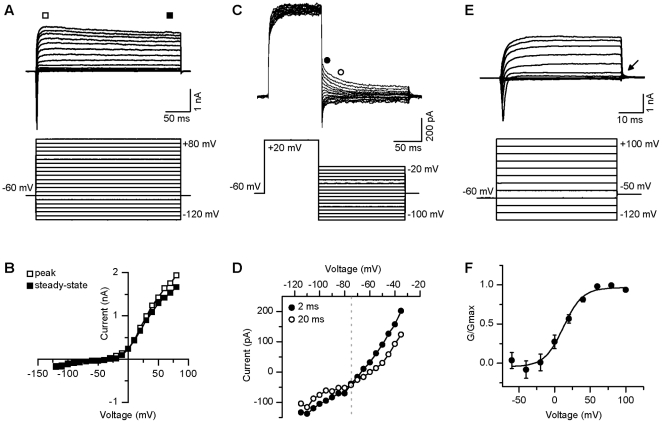
Figure 3. Voltage-gated potassium currents from individual GFP+ TK23 cells.
A, Representative example of delayed rectifier current (upper panel) evoked by depolarizing current steps (lower panel; steps range from −120 mV to +80 mV; Vm = −60 mV). B, Peak (open square) and steady-state (filled square) current-voltage plot for the cell shown in A. C, Representative example of the protocol used to determine K+ reversal potential. K+ current in upper panel, protocol in lower panel (steps range from −100 mV to −20 mV; pre-pulse to +20 mV; Vm = −60 mV). D, Current-voltage relationship from data in C, illustrating values taken at 2 ms (filled circle) and 20 ms (open circle) after the end of the conditioning pulse to +20 mV. Reversal potential is noted as the point at which the two lines intersect (dashed gray line). E, Another example of delayed rectifier current (upper panel) evoked by short depolarizing current steps followed by a step to −50 mV for use in calculating K+ activation (lower panel; steps range from −120 mV to +100 mV; tail current step to −50 mV (arrow); Vm = −60 mV). F, Average (±sem) activation curve for all neurons (n = 35). Data obtained from the tail current (arrow in E), were used for the calculation of K+ channel activation.

