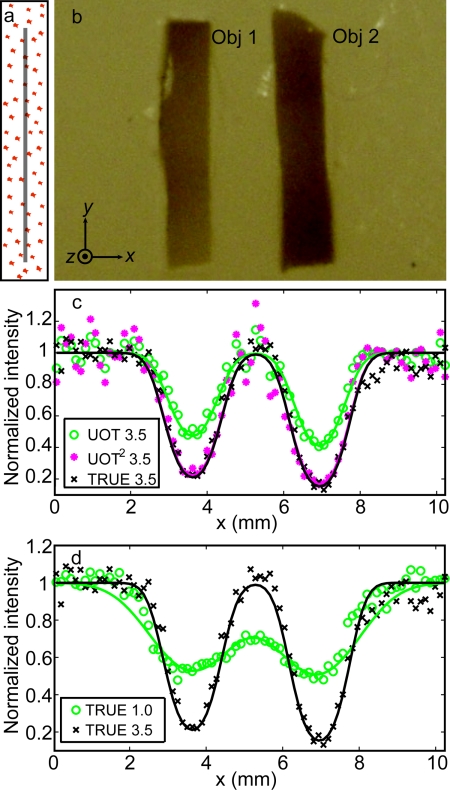
Figure 4.
Imaging results of the phantom with an optical thickness of 37.5. (a) Illustration of the phantom on a YZ plane showing the plane of the absorbing objects, indicated by the gray line, buried in the middle of the phantom. (b) Cross-section of the phantom on the central XY plane. The two absorbing inclusions (Obj 1 and Obj 2) had similar dimensions: x = 1.5 mm, y = 6.0 mm, and z = 0.8 mm, while the whole sample's dimensions were x = y = 60.0 mm and z = 7.5 mm. (c) Comparison of normalized UOT and TRUE images of the sample with the 3.5 MHz transducer. The fitted TRUE image coincides with the fitted UOT2 image, which is computed by the mathematic square of the UOT image signal strength. The coefficients of determination R2 of the TRUE 3.5, UOT 3.5, and UOT2 3.5 fits are 0.95, 0.93, and 0.90, respectively. Again, the results verify that the TRUE signal is proportional to the square of the UOT signal (UOT2), consistent with the square law4. (d) Normalized TRUE images with the 3.5 (black cross) and 1.0 (green circles) MHz transducers. The R2 value of the 1.0 MHz fit is 0.90. In (c) and (d), the symbols represent experimental data, while the solid curves represent Gaussian fits.

