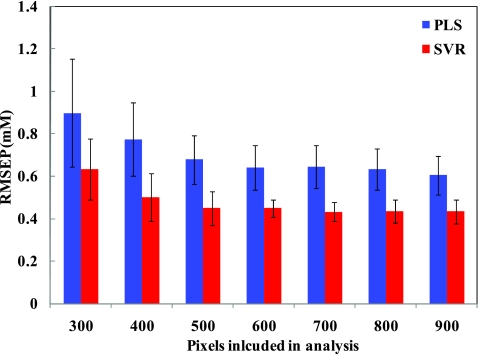
Figure 2.
Bar plot showing comparative performance of wavelength-selected PLS (blue) and SVR (red) calibration models in tissue phantoms for glucose prediction. The lengths of the bars are proportional to the average RMSEP and the associated error bars represent the standard deviation of the RMSEP over 100 iterations.

