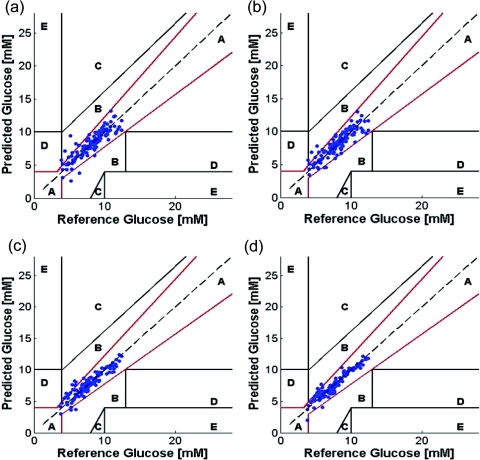
Figure 3.
Glucose prediction performance of wavelength-selected PLS and SVR calibration models in human subjects shown on the Clarke error grid. PLS calibration results are shown in (a) and (b) for 300 and 900 spectral points respectively. SVR calibration results are shown in (c) and (d) for 300 and 900 spectral points respectively.

