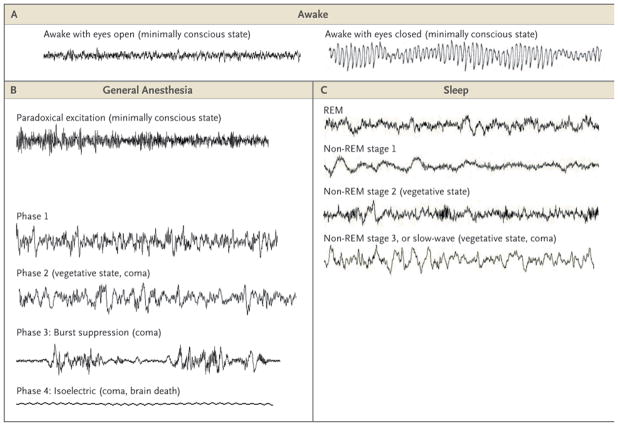
Figure 1. Electroencephalographic (EEG) Patterns during the Awake State, General Anesthesia, and Sleep.
Panel A shows the EEG patterns when the patient is awake, with eyes open (left) and the alpha rhythm (10 Hz) with eyes closed (right). Panel B shows the EEG patterns during the states of general anesthesia: paradoxical excitation, phases 1 and 2, burst suppression, and the isoelectric tracing. Panel C shows the EEG patterns during the stages of sleep: rapid-eye-movement (REM) sleep; stage 1 non-REM sleep; stage 2 non-REM sleep, and stage 3 non-REM (slow-wave) sleep. The EEG patterns during recovery from coma — coma, vegetative state, and minimally conscious state — resemble the patterns during general anesthesia, sleep, and the awake state. EEG tracings during sleep are from Watson et al.5

