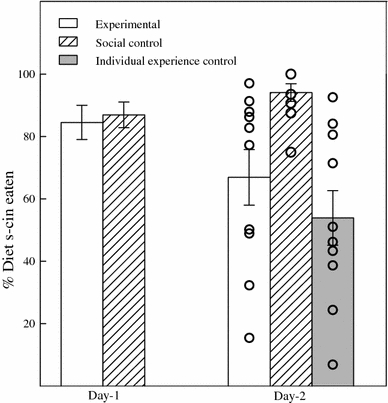
Fig. 1.

Mean ± SEM percentage of diet s-cin eaten by experimental and control subjects on day-1 and day-2. For day-2: circles indicate individual data points; due to overlapping values, the number of circles may not equal the number of rats in each group
