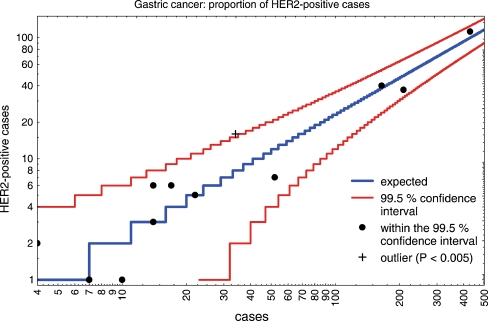
Fig. 2.
The number of HER2-positive gastric cancer cases (HER2 3+, HER2 2+/amplified) per institute of pathology in relation to the number of cases investigated was plotted on a logarithmic scale. The 99.5% confidence interval is indicated by red lines. In institutions with a low number of assessments, the confidence interval is broader. The expected rate calculated from the mean value of 14 institutions within the 99.5% confidence interval is demonstrated by a blue line. There is one institution outside the 99.5% confidence interval (indicated by a black cross). Institutes with a positivity rate within the 99.5% confidence interval are represented by black points. The confidence interval might narrow over time when more assessments are available for consideration

