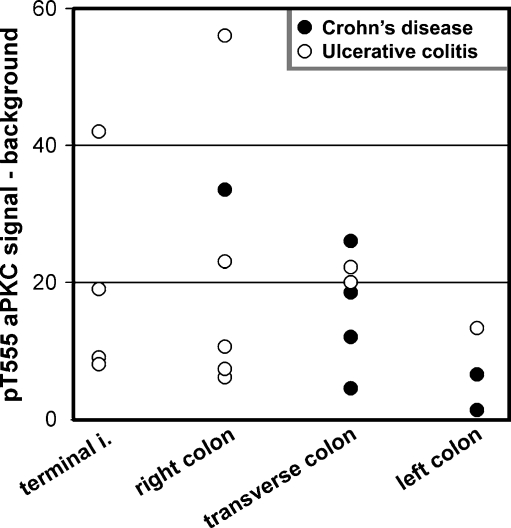
Fig. 3.
Distribution of values of pT555 aPKC signal in terminal ileum (terminal i.), right colon, transverse colon, and left colon. Data are shown as in Fig. 2, but only from samples with score 0. In this case, samples obtained from the same patient (in 12 cases) were included. There were no statistically significant differences among the values for the different sites

