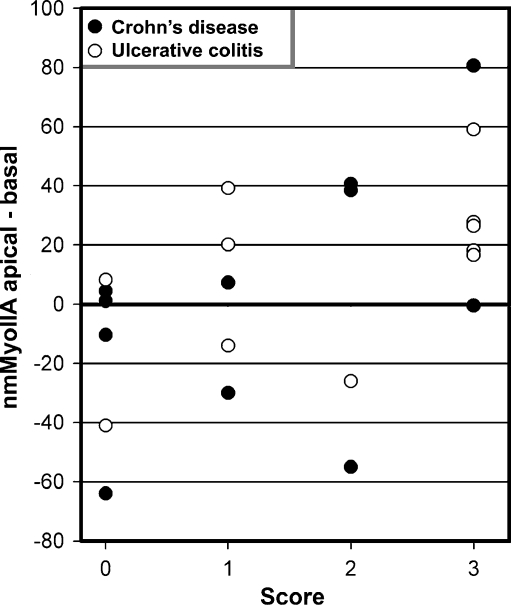
Fig. 5.
nmMyoIIA signal quantified in IBD patients. Average pixel intensities in one a ROI and one b ROI per cell were measured in several randomly selected cells per patient. The average of the differences for each patient was plotted against the inflammation score. There was a statistically significant difference (p < 0.05) between the score 0 and 3 groups

