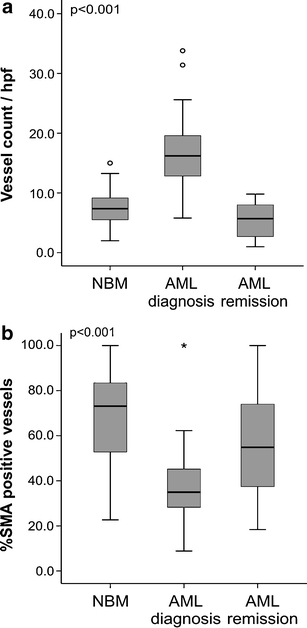
Fig. 1.

Bone marrow vessel count and pericyte coverage in AML (a) Boxplot of vessel count in AML bone marrow compared with normal bone marrow and AML remission. Vessel count in bone marrow biopsies of AML patients is significantly (p < 0.001) higher than in NBM or AML remission group. Median values are represented by a bar in the boxplot. (b) Boxplot of percentage SMA-positive vessels in bone marrow biopsies of newly diagnosed AML patients, normal controls and AML patients in remission. Pericyte coverage is significantly (p < 0.001) lower in bone marrow biopsies of AML patients at diagnosis. Median values are represented by a bar in the boxplot
