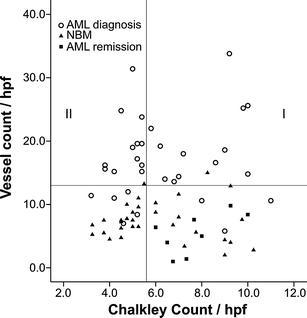
Fig. 3.

Scatterplot representing the biopsies of AML at diagnosis, at remission and Normal Bone Marrow. AML biopsies at diagnosis with a ‘low vessel count’ are displayed below the Y-axis reference line (13 microvessels/hpf), based on the fact that >95% of Normal Bone Marrow and AML remission biopsies had a vessel count below 13 microvessels/hpf. The X-axis reference line divides AML biopsies at diagnosis with a ‘high vessel count’ into two subgroups according to the median Chalkley count of 5.4 in AML at diagnosis and the identical cut-off point set by the median Chalkley count of the NBM and AML remission biopsies. Samples with a Chalkley count >5.4 were defined as ‘vessel hyperplasia’ (group I) and samples ≤5.4 as ‘angiogenic sprouting’ (group II). AML biopsies: Spearman’s rho 0.15, p = 0.42
