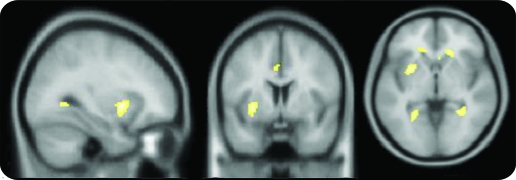
Figure 1. EEG-fMRI group analysis.
Results of a second-level random-effects group analysis of 19 patients with focal epilepsy syndromes. For visualization, consistent common activations (p < 0.001) are overlaid on axial slices of a mean T1-weighted template brain (X, Y, Z = −30, 6, −2, coordinates in Montreal Neurological Institute space). The activation within the region of interest near the presumed area tempestas was significant at p < 0.05 (family-wise error), when correcting for multiple comparisons across the search region (2,744 mm3).

