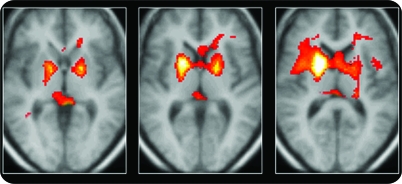
Figure 2. Flumazenil PET group comparison.
Regions of significantly increased flumazenil volume of distribution in 18 patients with focal epilepsy syndromes compared with those of 24 normal control subjects. The hot metal color scale displays all voxels falling below p < 0.01 for display; increasing intensity corresponds to increased significance.

