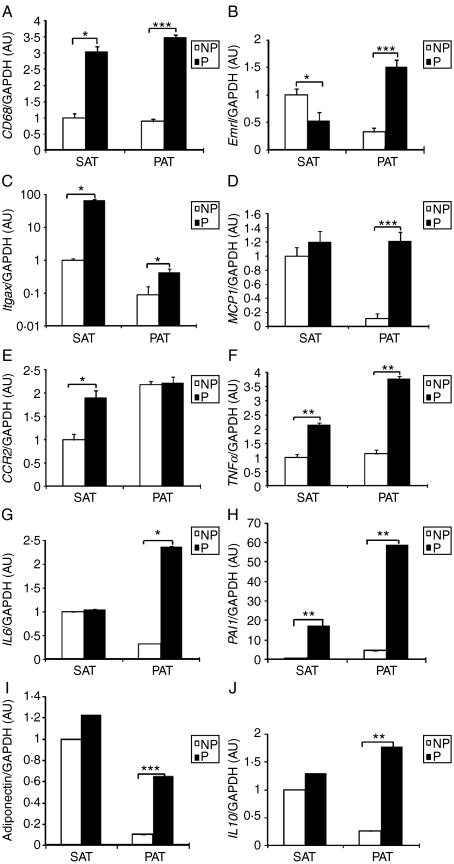
Figure 5.
Gene expressions of inflammatory and anti-inflammatory adipokines in adipose tissue between the P group and the NP group. (A) CD68 gene expression of the NP group (n=10) and the P group (n=13). (B) Emrl gene expression of the NP group (n=10) and the P group (n=18). (C) Itgax gene expression of the NP group (n=10) and the P group (n=18). (D) MCP1 gene expression of the NP group (n=8) and the P group (n=12). (E) CCR2 gene expression of the NP group (n=9) and the P group (n=10). (F) TNFα gene expression of the NP group (n=10) and the P group (n=17). (G) IL6 gene expression of the NP group (n=6) and the P group (n=8). (H) PAI1 gene expression of the NP group (n=7) and the P group (n=11). (I) Adiponectin gene expression of the NP group (n=10) and the P group (n=16). (J) IL10 gene expression of the NP group (n=8) and the P group (n=9). Macrophage-related adipokine gene expression was evaluated by real-time quantitative RT-PCR. Data are presented as the mean±s.e.m. A two-tail Student's t-test was performed. P versus NP: *P<0·05, **P<0·01, ***P<0·001.

