
Figure 1.
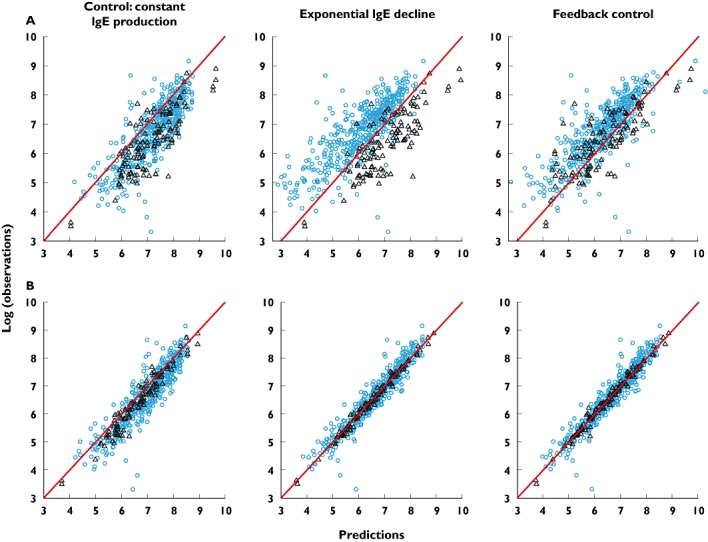
Comparison of individual predicted vs. observed for total IgE data for the competing models. The first row, A, contrasts observed total IgE and individual predictions from models based on data with up to 1 year of treatment. Row B contrasts observed total IgE and individual predictions from models based on data with up to 5 years of treatment. The comparisons are given for observations from the 3–5 year data only. The blue dots are data from paediatric study 10E1, the black triangles from the adult EXCELS study. The line of identity is red. Note that minimization for the control model in row B terminated with errors and should be regarded cautiously. 10E1 ( ); EXCELS (▵)