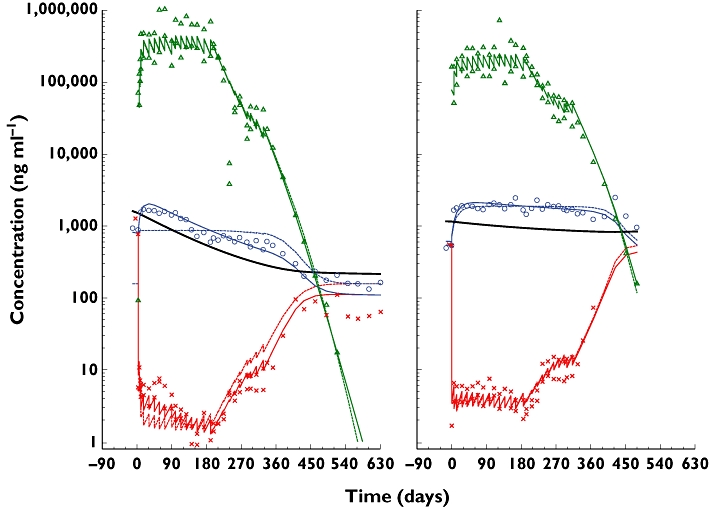
Figure 5.

Example individual fits for the control (no change in IgE production) and feedback models for a phase I study (Q0673g) in patients with allergic rhinitis. The solid lines are the feedback model, the dashed the control and the symbols are the measured data. On the left is a 49-year-old, 58.5-kg, 152-cm Asian woman with 388 IU ml−1 (931 ng ml−1) baseline IgE given 0.030 mg kg−1 bodyweight per IU ml−1 baseline IgE every 2 weeks for 26 weeks then 0.0015 mg kg−1 per IU ml−1 for 18 weeks. IgE production decreased from 1523 to 216 µg day−1 over 517 days (thick solid line). The decrease in IgE production paralleled the decrease in total IgE. On the right is a 22-year-old, 81.9-kg, 152-cm Asian man with 205 IU ml−1 (492 ng ml−1) baseline IgE, given 0.030 then 0.005 mg kg−1 bodyweight per IU ml−1 baseline IgE every 2 weeks. The model estimated IgE production decreased from 1188 to 859 µg day−1 over 397 days. Omalizumab ( ); total IgE (
 ); IgE production (—); free IgE (
 )
)
