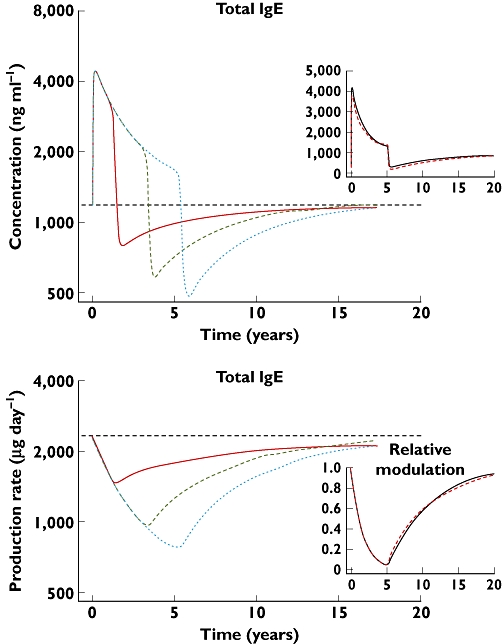
Figure 6.

Long-term predictions of total IgE and IgE production rate, based on the final feedback model, following 1, 3 or 5 years of treatment with omalizumab 375 mg for a typical 35 year old, 65 kg, Caucasian male subject with screening IgE concentration of 550 IU ml−1 or 1320 ng ml−1. The insets show the effect of age on total IgE and the relative change in the modulator of IgE production. The simulations are for 5 years treatment of patients initially aged 6 and 35 years. Note that the scales for the main figures are logarithmic to show the parallelism of total IgE and IgE production, the insets linear to show better the extent of the changes. For the IgE modulation scale, 1 is the up-regulated state before treatment, 0 the background production. For the main figures, the lines are: 1 year ( ); 3 years (
 ); 5 years (
 ). For the insets: 25-year-old (
 ); 6-year-old (—)
