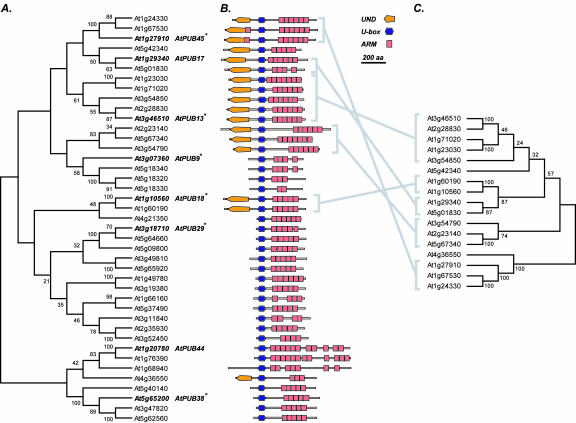
Figure 2.
Phylogenies of U-box and UND protein sequences. The phylogenies were generated with neighboring joining with 400 bootstrap replicates and were rooted at midpoint. The bootstrap values are shown as percentages. A, Phylogeny was generated using the U-box protein sequences from the AtPUB-ARM proteins. The database gene names for AtPUB-ARM genes that were tested for RNA expression are italicized, and their synonyms are shown on the right. Asterisks, AtPUB-ARM proteins that were further tested for E3 ligase activity. B, Domain organizations of the AtPUB-ARM proteins, ordered according to A. The color-coding schemes are the same as those in Figure 1. C, Phylogeny of UND sequences. The major groups within the UND phylogeny are linked by gray lines to those in the U-box phylogeny.

