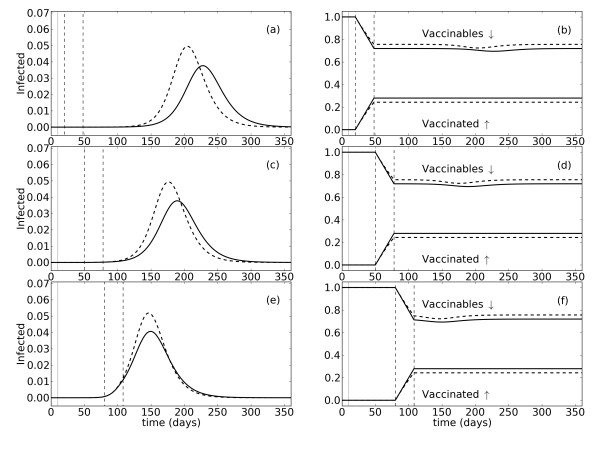
Figure 2.
Effects of vaccination in the proportional and non-proportional models for different campaign starts. The proportional model is represented by dashed black lines and the non-proportional model by solid black lines. The graphs in the left column (a, c, e) show the proportion of infected people as a function of time. The graphs in the right column (b, d, f) show the proportion of the population vaccinated, and those still eligible for vaccination (vaccinable), over time. The initial population size is 108 people. Infected individuals are inserted into the susceptible population with a pulse on day 10 (t0 = 10; solid vertical gray line). The vaccination campaign is initiated on day 20 (a, b), 50 (c, d), or 80 (e, f), and lasts 28 days. Start (ta)and stop (tb) times of the campaign are indicated by dashed vertical lines. Vaccination occurs at a rate of 1% of the eligible population per day (proportional; k = 0.01), or at a maximum of 106 vaccines per day (non-proportional,  ).
).

