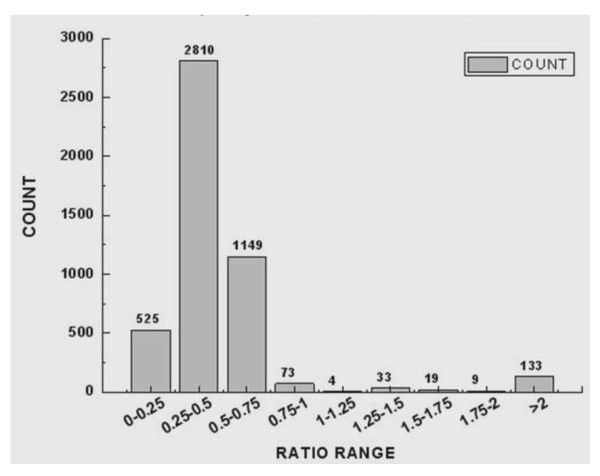
Figure 3.
The distribution of observed gene ratio. The distribution of observed gene ratio values for the gene expression of the schistosomula from Wistar Rat compared with those from BALB/c mice. The majority of differential gene expression is seen in 2810 genes down regulated in parasites from Wistar rat host 0.25-0.5 ratio (2-4 fold down regulated).

