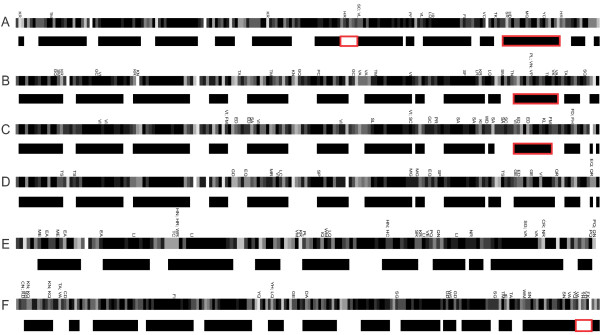
Figure 3.
Schematic representation of mutation distribution in gapless alignment of cyclins. Cyclins: A, animal A; B, animal B; C, fungal B; D, animal B3; E, animal D; F, animal E. Atypical replacements are indicated above each rectangle in Figures A through E. The upper rectangle in Figures A through E represents the position of amino acids in protein globule sample by color transitions from black, inner amino acids, to white, those on the surface. The lower rectangle in Figures A through E represents the secondary structure in protein sample: black, helical structure, white, turns. Fringes of secondary structure are colored depending on whether the number of all replacements is significantly greater (red) than expected, or as expected (white).

