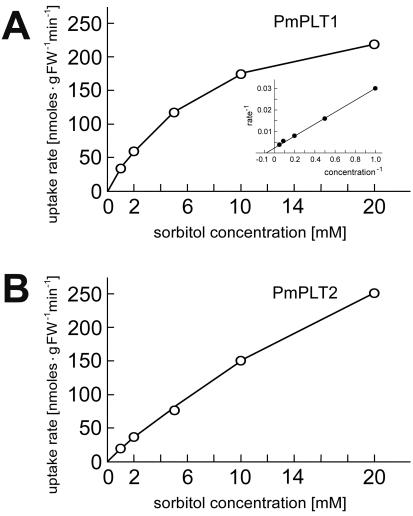
Figure 5.
Analysis of substrate affinities of PmPLT1 and PmPLT2 for sorbitol in transgenic yeast cells. A, Michaelis-Menten plot for the sorbitol uptake by PmPLT1. Inset, Lineweaver-Burk plot of the same data set. B, Michaelis-Menten plot for the sorbitol uptake by PmPLT2. Uptake rates could not be saturated under the conditions analyzed. Each curve represents one out of three independent transport tests. From these analyses, the Km value for sorbitol of PmPLT1 was calculated to be 12.3 ± 0.9 mm. No Km value could be calculated for PmPLT2.

