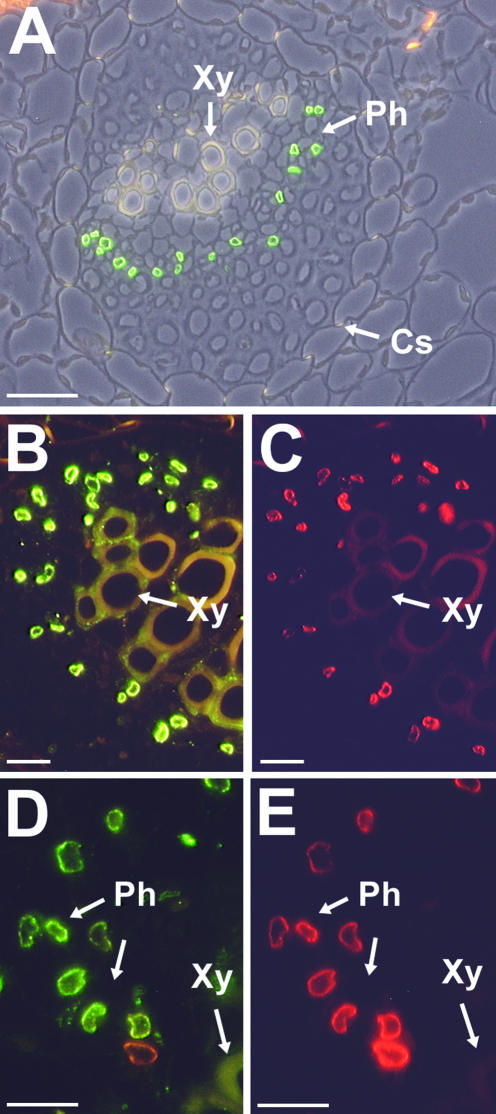
Figure 8.
Immunodetection of PmPLT1 and PmPLT2 proteins in sections from common plantain source leaves. A, The section was labeled with anti-PmPLT1 antiserum and with fluorescent goat anti-rabbit IgG antiserum. The resulting green fluorescence is found only in cells of the common plantain phloem. For this figure, a fluorescence image was superposed on a photo taken under white light. Similar results were obtained with sections treated with anti-PmPLT2 antiserum and with fluorescent goat anti-rabbit IgG antiserum (data not shown). B and C, The presented section was double labeled with anti-PmPLT1 antiserum (B) and with the monoclonal anti-PmSUC2 antiserum 1A2 (C). Binding of antibodies was visualized under a fluorescent microscope after simultaneous incubation with fluorescent goat anti-rabbit IgG antiserum (B; green fluorescence, PmPLT1 localization) and fluorescent goat anti-mouse IgG antiserum (C; red fluorescence, PmSUC2 localization in companion cells). D and E, The presented section was double labeled with anti-PmPLT2 antiserum in D and with the monoclonal anti-PmSUC2 antiserum 1A2 in E. Binding of antibodies was visualized under a fluorescent microscope after simultaneous incubation with fluorescent goat anti-rabbit IgG antiserum (D; green fluorescence, PmPLT2 localization) and fluorescent goat anti-mouse IgG antiserum (E; red fluorescence, PmSUC2 localization in companion cells). The weak orange signal in one of the companion cells in D results from the extremely strong PmSUC2 signal of this cell, which is seen in E. Xy, Xylem; Ph, phloem; Cs, Casparian stripes. Scale bars = 25 μm in A, 10 μm in B and C, and 10 μm in D and E.

