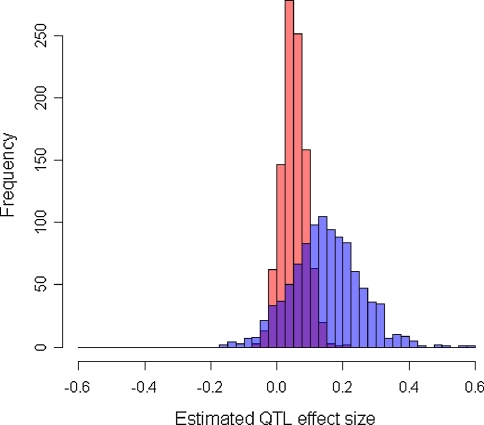
Fig. 1.
Distributions of the estimated QTL effect size before (blue) and after (red) adjustment in linear regression for association studies of QTL under two-tail extreme selection The case shown is when a quarter of the individuals were sampled at 1:1 ratio from the two tails of the trait distribution from a population of 5,000 individuals, each containing a QTL that had MAF of 10% and explained 5% of the trait variation. The means (SEs) of the estimated QTL effect size ( ) from linear regression are, respectively, 0.144 (0.105) and 0.050 (0.036) before and after adjustment (Color figure online)

