
Figure 2.
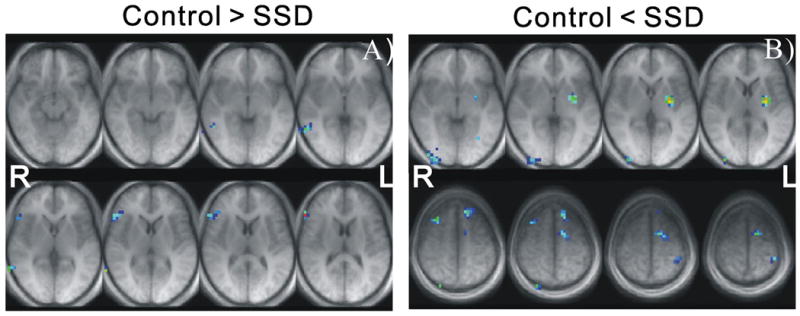
Group differential maps illustrated in transverse AC-PC orientation in Talairach (TLRC) space. (A) Eight consecutive axial slices from TLRC z=-9mm to z=+13mm, demonstrating the hypoactivation identified in the SSD group; (B) Axial slices from TLRC z=-3mm to z=+7mm (top row), and TLRCz = +48 mm to z = +58 mm (bottom row), demonstrating the hyperactivation identified in the SSD group.