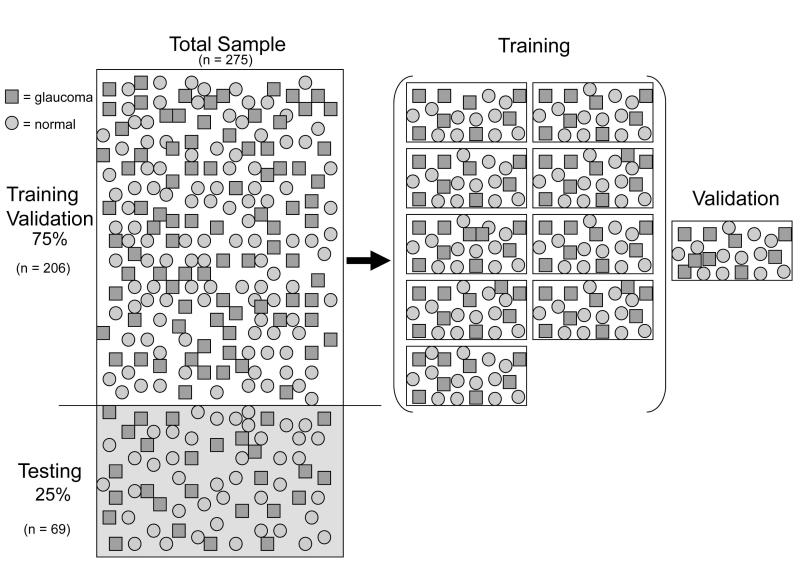
Figure 1.
Illustration of how the classification data were managed (□ = Glaucoma, ○ =Normal). The total sample was divided into training and test subsets (75% / 25%). The Training data (n=206/275) were further stratified into 10 equal partitions. Nine partitions were used to induce a classification tree while the 10th partition (validation) was held-out to evaluation performance of the induced decision tree. For each of 10 iterations, the validation partition was swapped with a new partition and another decision tree was induced and then validated. The final best classifier was then evaluated on the previously unused test subset (n = 69/275).

