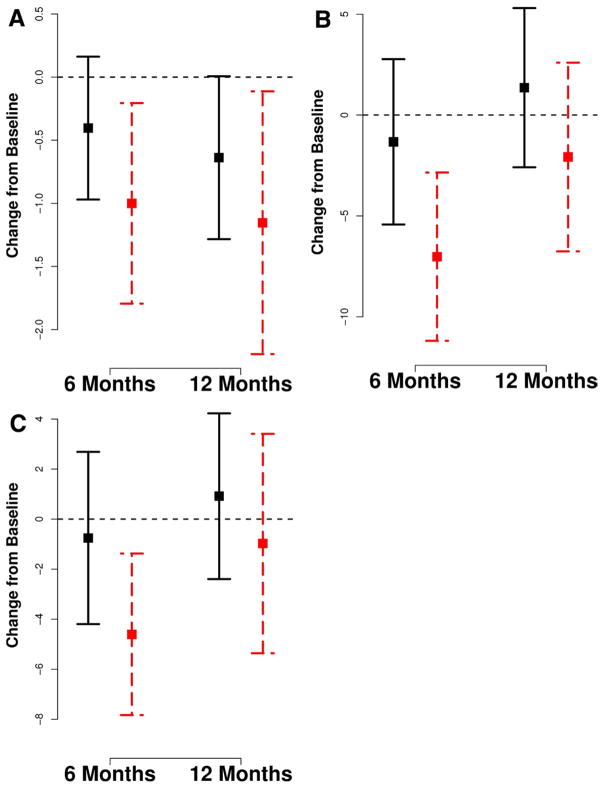
FIGURE 2.
Plots of change scores from baseline (horizontal dotted line) for drug use outcomes at follow-up assessments. Error bars represent ± 2 SE. Solid vertical lines are for control group; dashed vertical lines are for personalized motivational intervention group. A, Texas Christian University Drug Screen—II (TCUDS) score. B, Drug-days. C, Primary drug.

