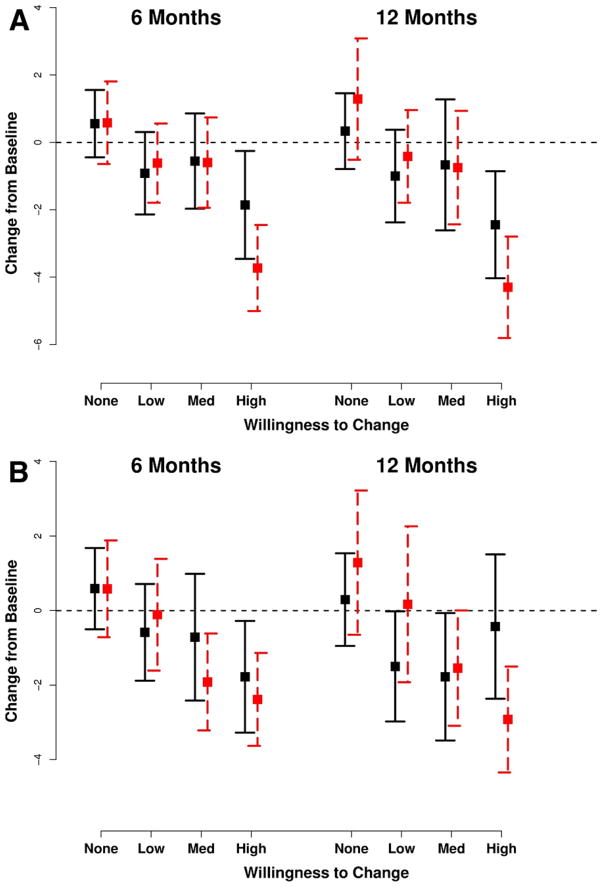
FIGURE 6.
Plots of change scores from baseline (horizontal dotted line) for drug use outcomes at follow-up assessments for subjects at different stages of change at baseline. Error bars represent ± 2 SE. Solid vertical lines for control group; dashed vertical lines for personalized motivational intervention group. A, Texas Christian University Drug Screen—II (TCUDS) by Stages of Change Readiness and Treatment Eagerness Scale (SOCRATES) D, Recognition. B, TCUDS by SOCRATES D, Taking Steps.

