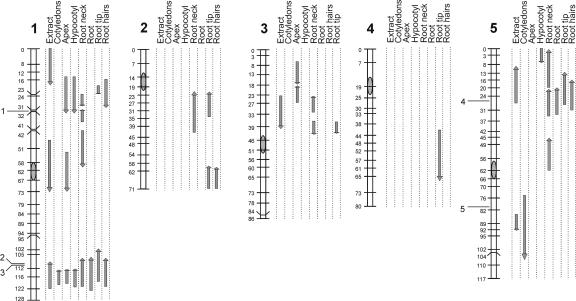
Figure 4.
Ler/Cvi linkage map showing the genetic locations of QTLs affecting PGM activities, determined in whole-seedlings extracts, and in various organs of intact seedlings. The lengths of the arrows indicate the 2-LOD support intervals. The directions of the arrows indicate the Ler allelic phenotype (upward increasing, downward decreasing). The locations of (putative) PGM genes on chromosomes 1 and 5 is indicated: 1, At1g23190; 2, At1g70820; 3, At1g70730; 4, At5g17530; 5, At5g51820.

