Figure 10.
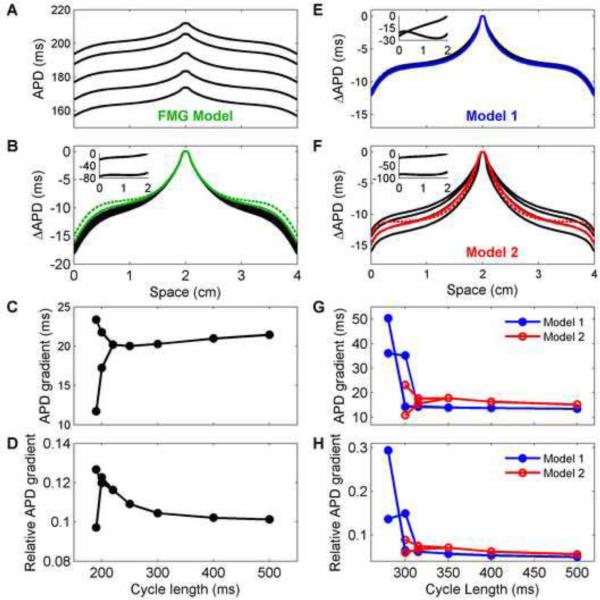
APD spatial profiles as a function of cycle length using (A–D) the FMG model and (E–H) Models 1 and 2 in a 4 cm × 4 cm square geometry. A. APDs obtained along center lines after pacing for 5 s for cycle lengths of 500, 400, 300, 250, and 220 ms (top to bottom). B. APD profiles plotted as the difference from the APD at the stimulus site. When adjusted for maximum APD, the profiles nearly coincide. The APD difference averaged for long and short cycle lengths is shown for cycle lengths of 200 (color, solid) and 190 ms (color, dashed) for beats 49 and 50 (200 ms) and beats 98 and 99 (190 ms). Insets show differences in APD from the APD at the stimulus site for beats 98 and 99 at a cycle length of 190 ms. C–D. Magnitude of APD dispersion as a function of cycle length (during alternans, dispersions for both long and short action potentials are shown). Although the APD dispersion increases slightly for long cycle lengths, the relative dispersion actually decreases because the APDs themselves are longer. The maximum dispersions occur during alternans, up to a maximum of about 13% of the stimulus site APD. EF. Difference in APD from the APD at the stimulus site obtained along center lines for cycle lengths of 1000, 500, 400, 350 ms (black, top to bottom) after pacing for (5, 5, 4, and 7 s, respectively). The APD difference averaged for long and short cycle lengths is shown for cycle lengths of 315 (color, solid) and 300 ms (color, dashed) for beats 49 and 50 (315 ms) and beats 98 and 99 (300 ms). Insets show differences in APD from the APD at the stimulus site for beats 98 and 99 at a cycle length of 300 ms. For Model 1, as for the FMG model, the profile is nearly independent of cycle length, even for averages during alternans. In contrast, Model 2 experiences larger decreases in APD at the tissue edges as the cycle length is decreased, and the average profiles during alternans have different shapes than the profiles without alternans. G–H. Magnitude of APD dispersion as a function of cycle length (during alternans, dispersions for both long and short action potentials are shown). Both the absolute and relative APD dispersions increase for shorter cycle lengths without alternans for Model 2, whereas only the relative dispersion increases for Model 1. The maximum dispersions during alternans reach a maximum of about 50 percent of the stimulus site APD for Model 1 and about 30 percent for Model 2. For the cycle lengths shown, alternans is discordant at the times indicated only for Model 1 at cycle lengths of 300 and 315 ms.

